Park Accessibility Impacts Housing Prices in Seoul

 ,
,
Abstract
:1. Introduction
2. Literature Review
2.1. Hedonic Price Methods (HPM)
2.2. Variables
3. Materials and Methods
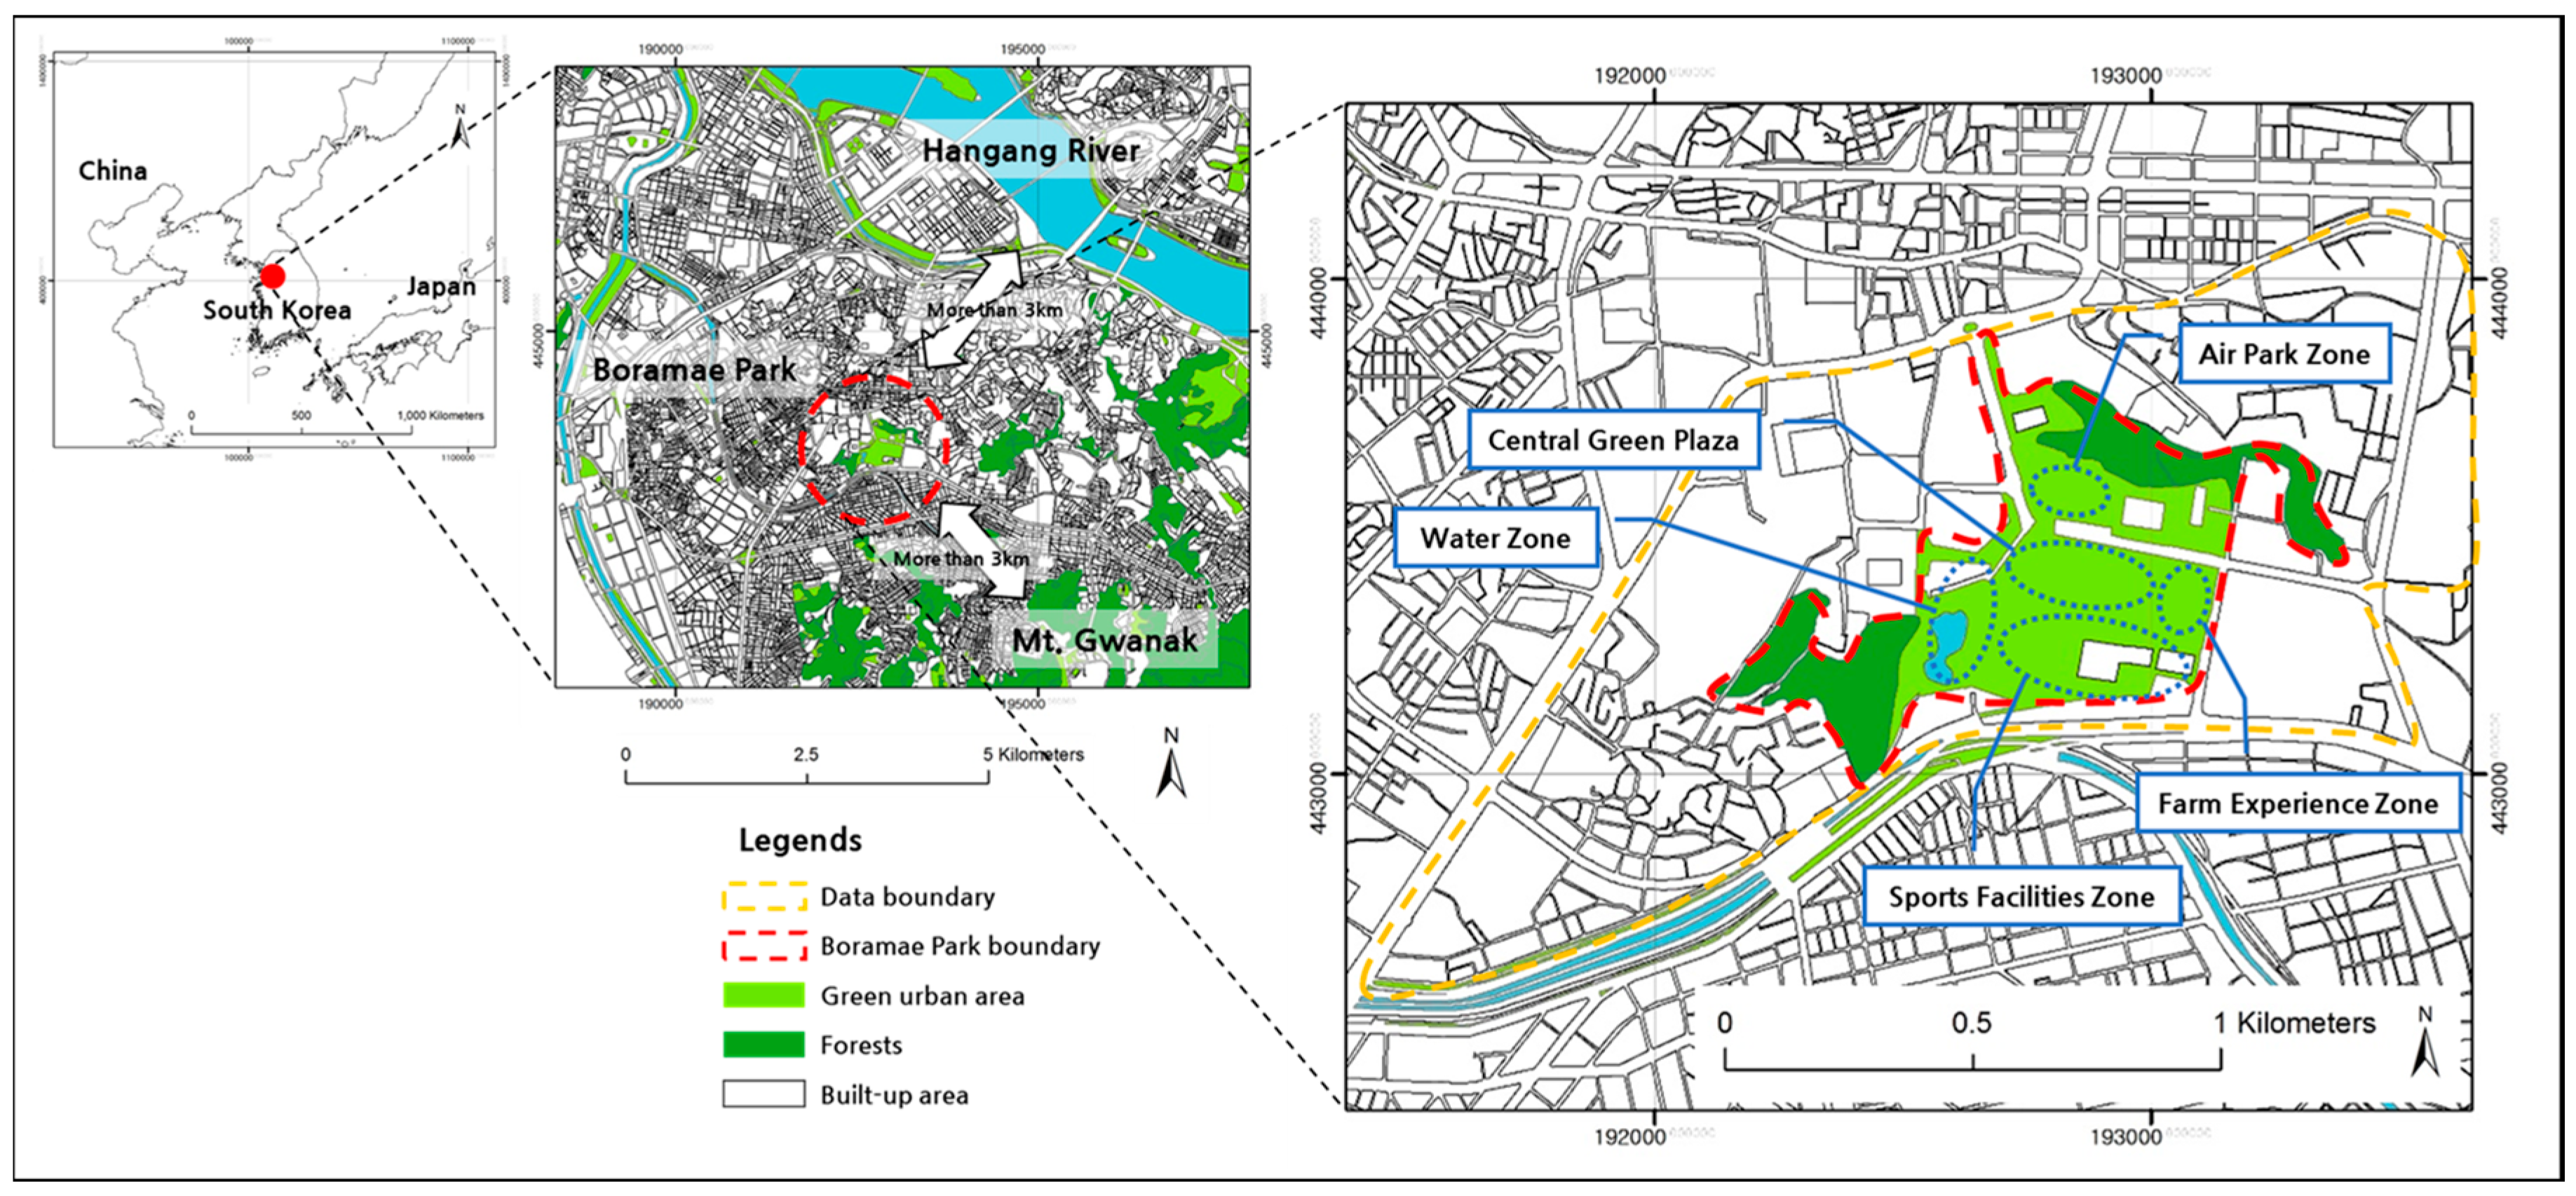
3.1. Study Site and Data
3.2. Methods
4. Results and Discussion
4.1. Hedonic Price Model Results
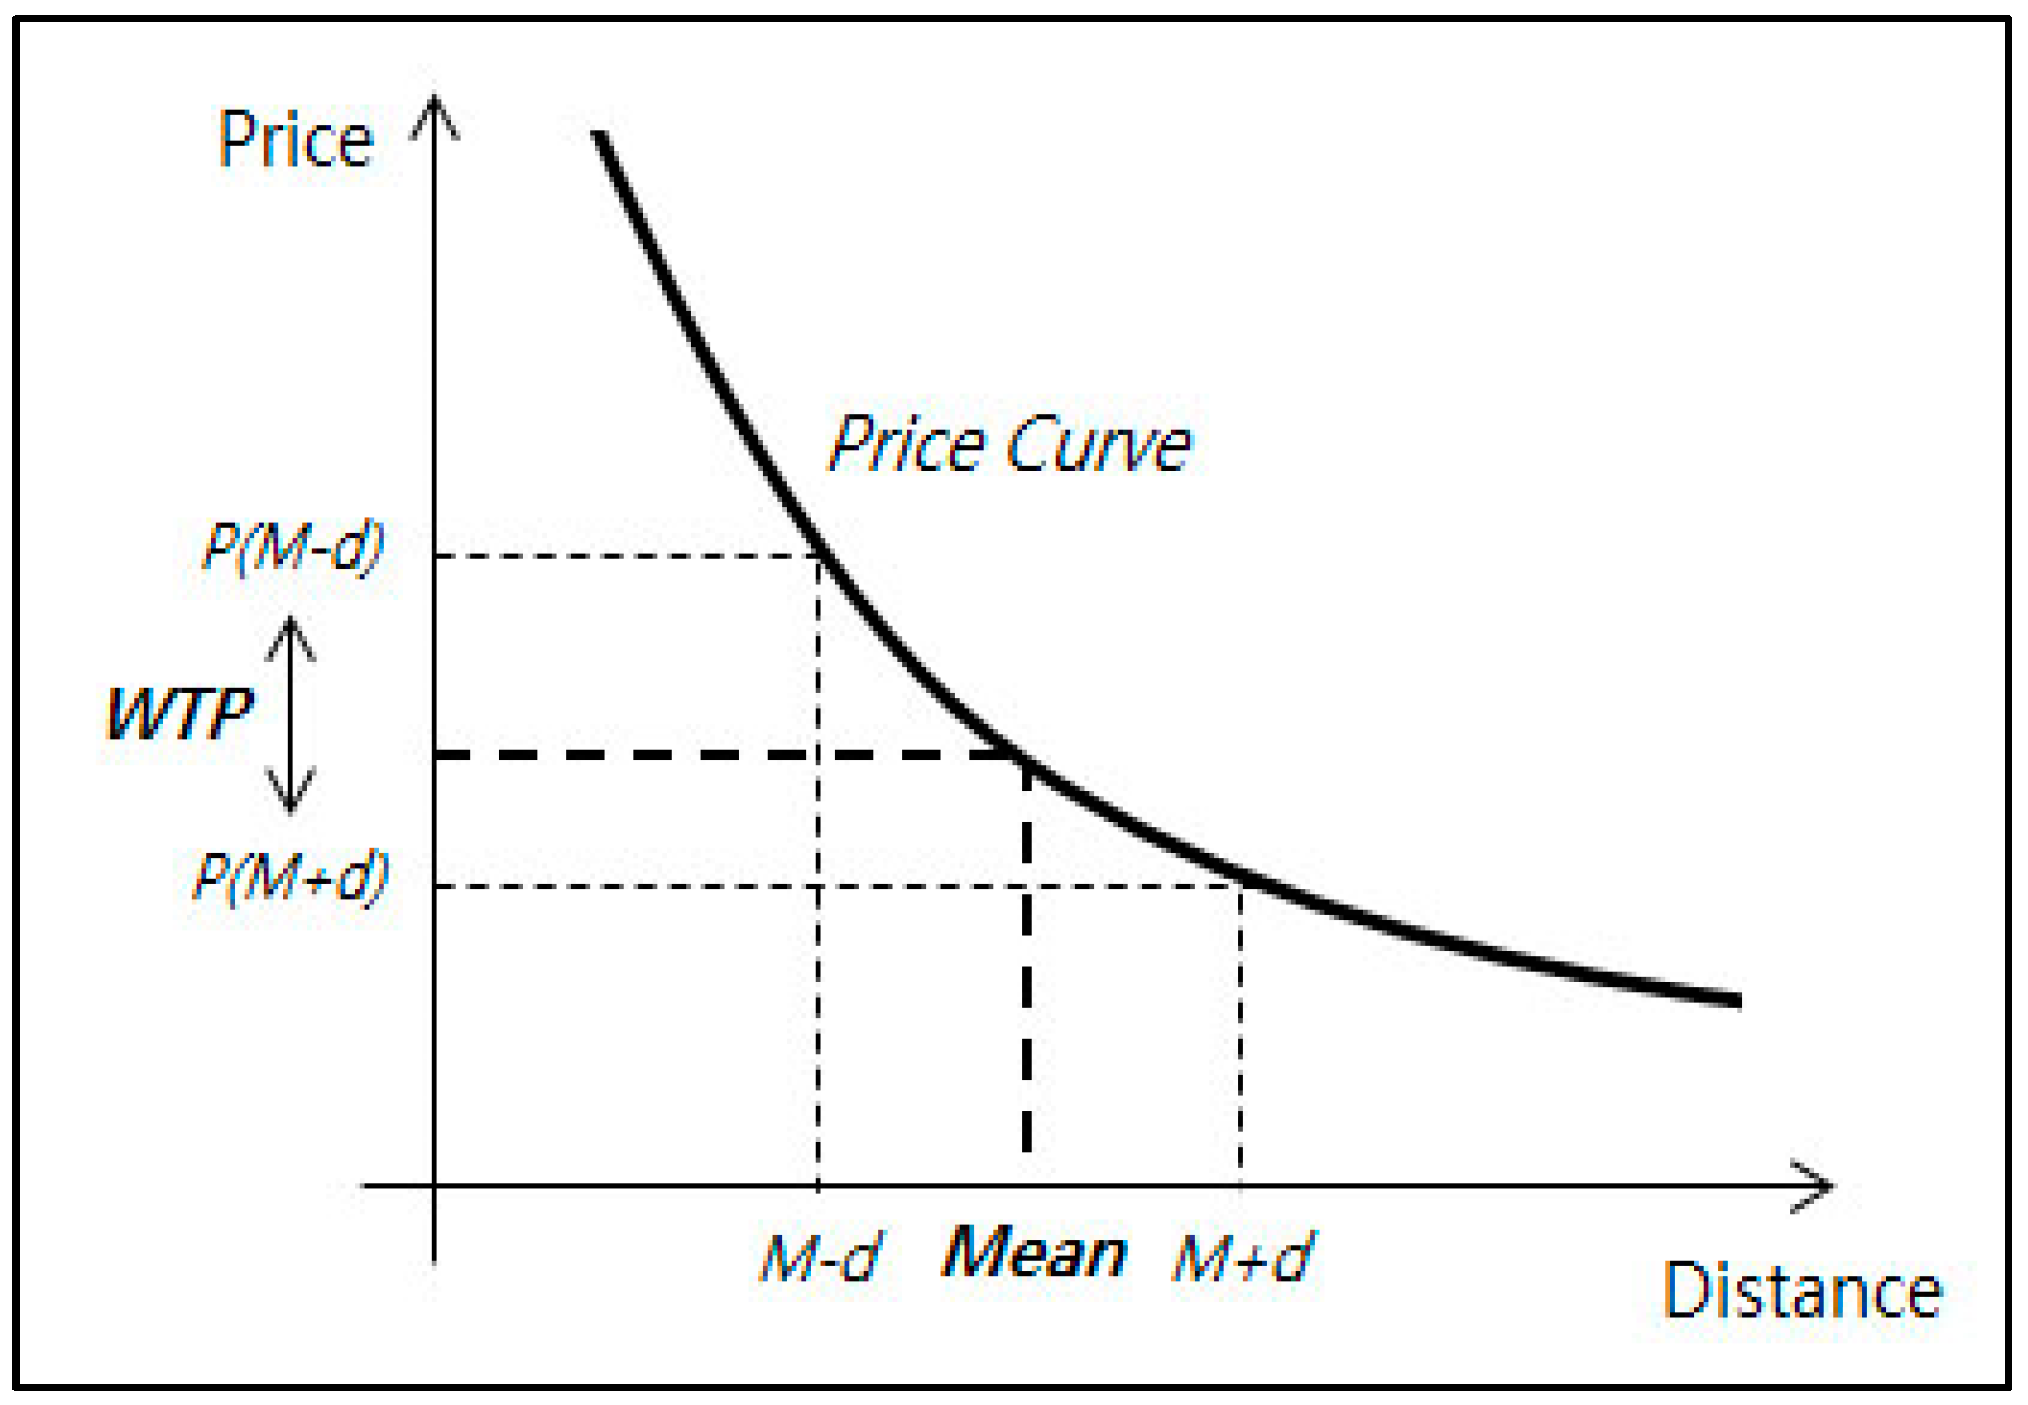
4.2. Changes in the Recognition of Cultural Services by Distances
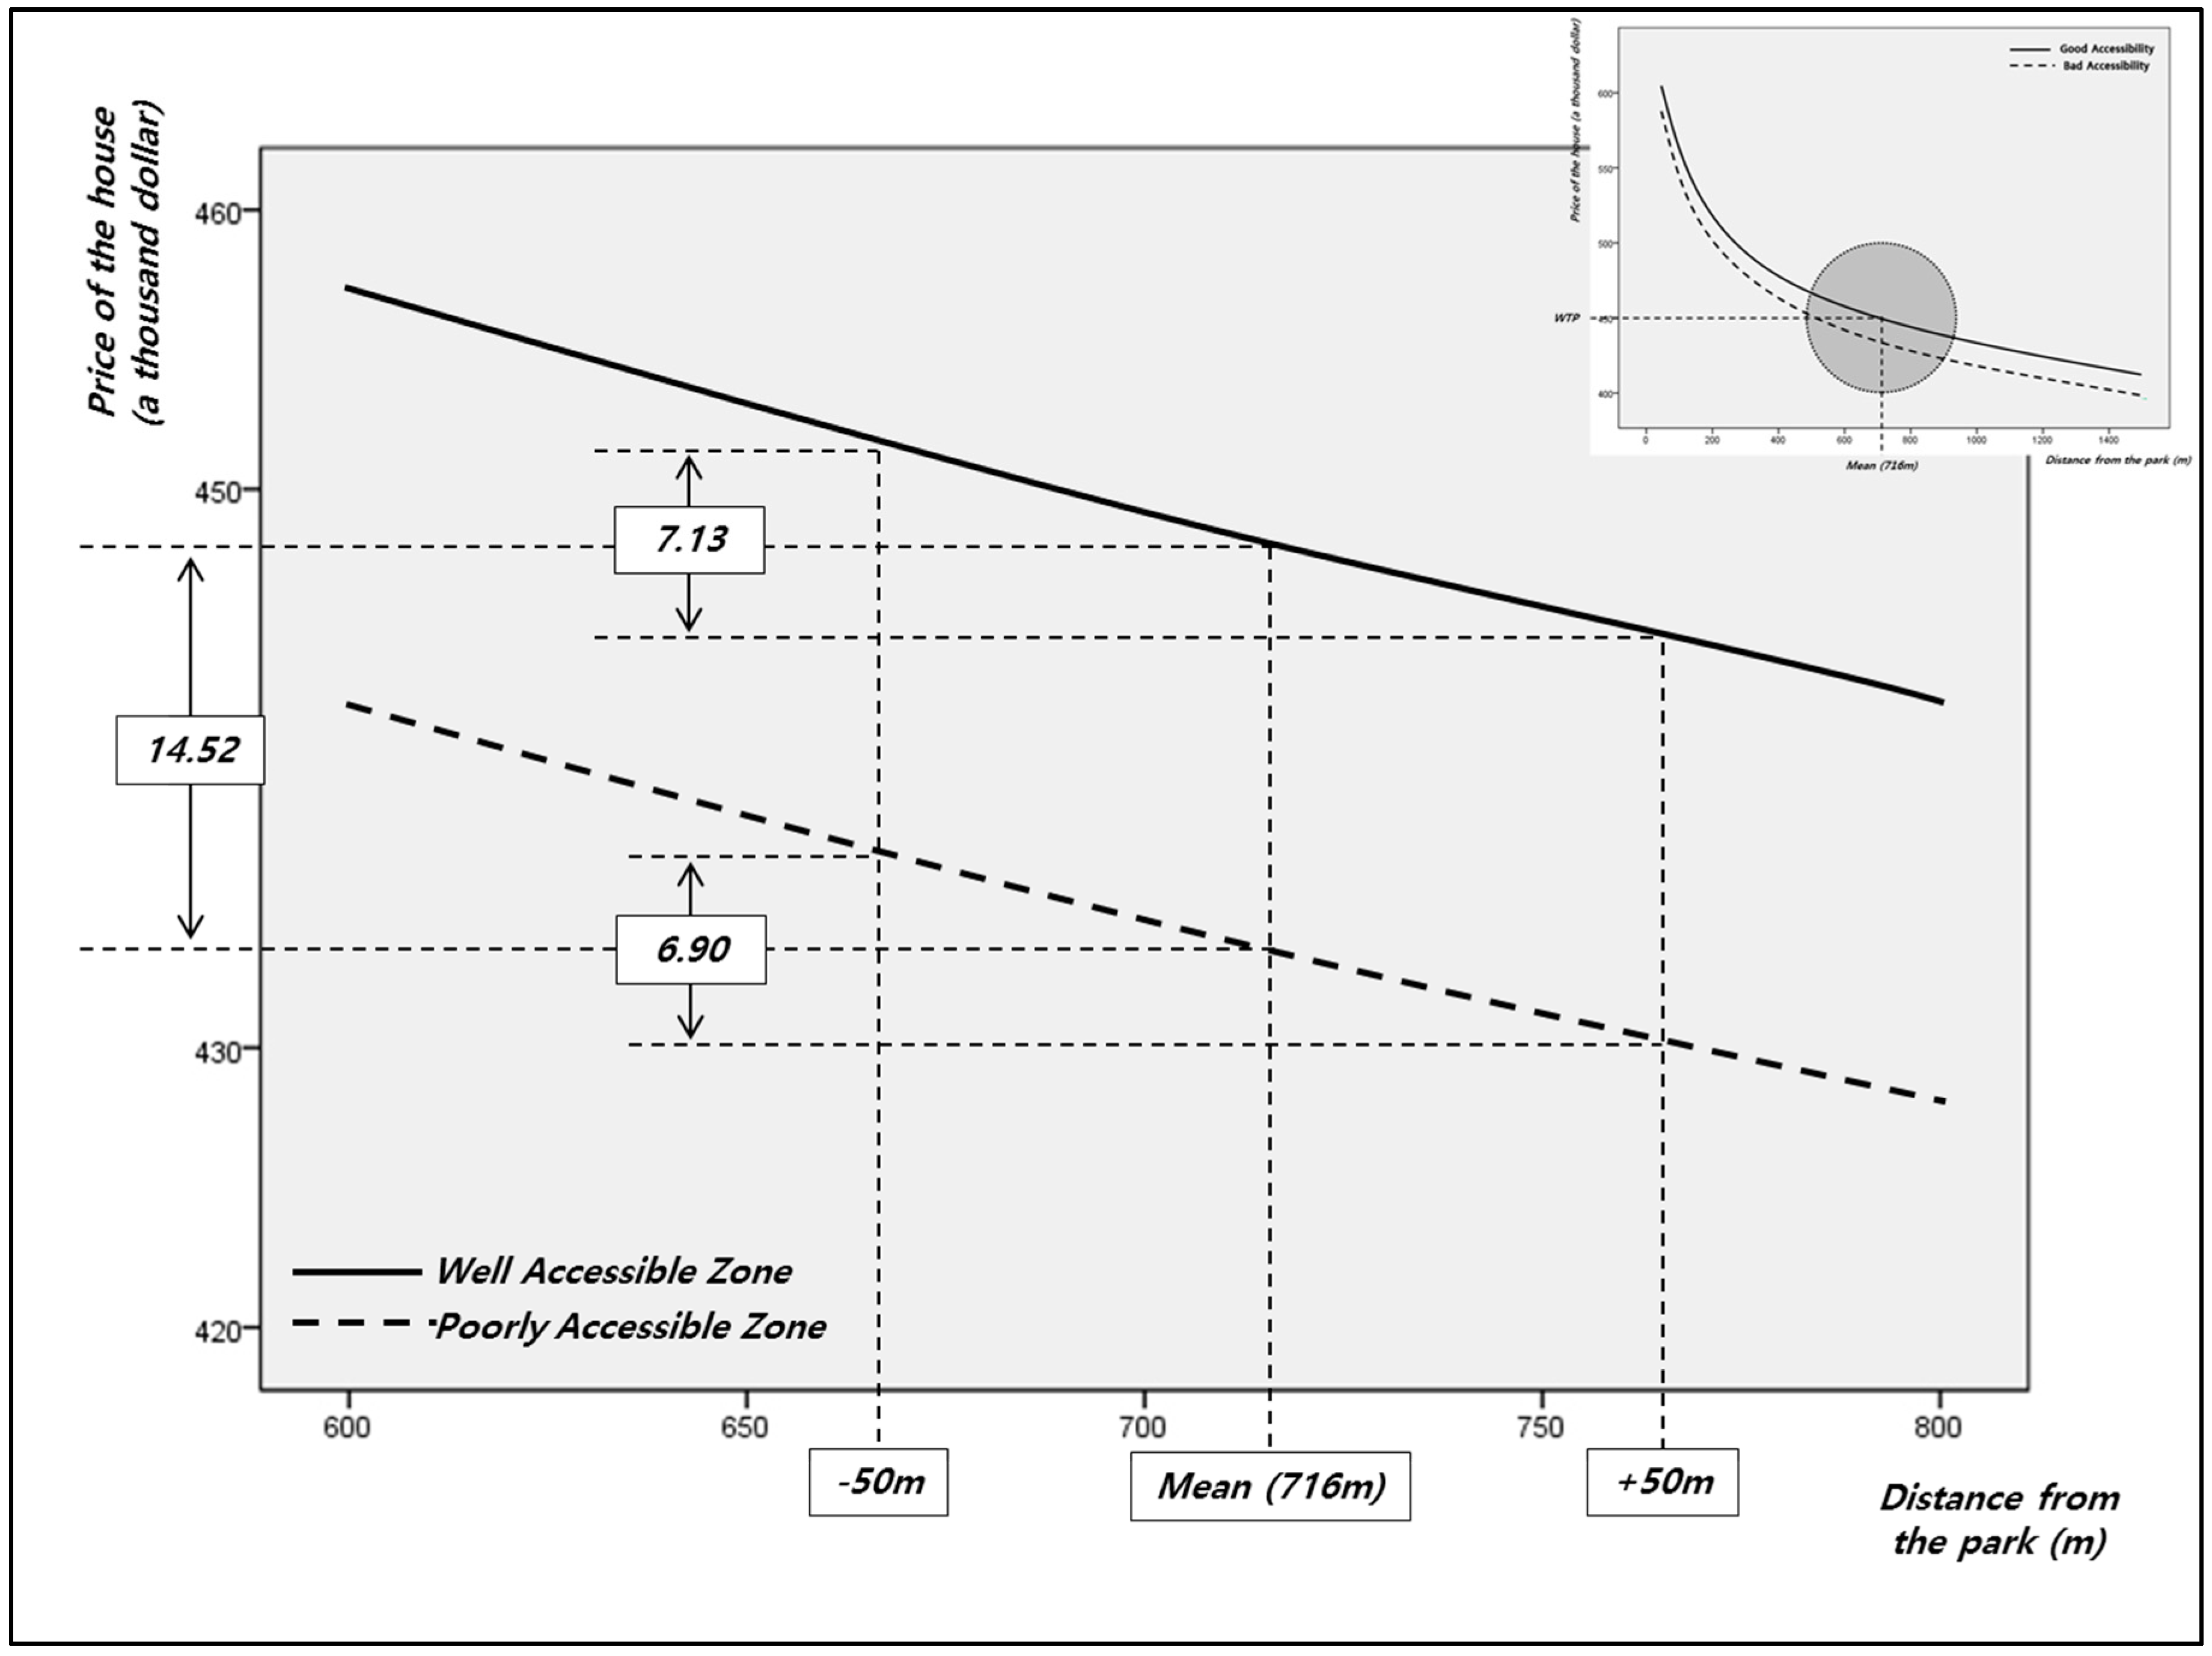
4.3. Changes in the Awareness of Cultural Services by the Level of Accessibility
5. Conclusions
Acknowledgments
Author Contributions
Conflicts of Interest
Appendix A

| N | Mean | Std. Deviation | Std. Error Mean | ||
|---|---|---|---|---|---|
| Price of the apartment | Poorly Accessible | 40 | 47,265.0 | 14,085.8 | 2227.2 |
| Well Accessible | 127 | 46,021.3 | 10,174.0 | 902.8 | |
| Distance from the park | Poorly Accessible | 40 | 542.2 | 295.1 | 46.7 |
| Well Accessible | 127 | 770.7 | 202.0 | 17.9 | |
| Price of the Apartment | Distance from the Park | |
|---|---|---|
| Mann-Whitney U | 2481.000 | 1349.000 |
| Wilcoxon W | 10,609.000 | 2169.000 |
| Z | −0.221 | −4.497 |
| Asymp. Sig. (2-tailed) | 0.825 | 0.000 |
Appendix B
| Pearson Correlation | Price of the Apartment | Area of a House | Floor Level of a House | Age of a Building | Distance to the Nearest Elementary School | Distance from the Park | Zone |
|---|---|---|---|---|---|---|---|
| Price | 1.000 | 0.837 | −0.024 | −0.406 | −0.264 | −0.064 | −0.011 |
| Area | 0.837 | 1.000 | −0.051 | −0.185 | −0.020 | −0.112 | −0.089 |
| Floor level | −0.024 | −0.051 | 1.000 | 0.134 | 0.136 | −0.176 | 0.027 |
| Age | −0.406 | −0.185 | 0.134 | 1.000 | −0.364 | −0.341 | 0.293 |
| Distance to the school | −0.264 | −0.020 | 0.136 | −0.364 | 1.000 | −0.086 | −0.565 |
| Distance from the park. | −0.064 | −0.112 | −0.176 | −0.341 | −0.086 | 1.000 | 0.465 |
| Zone | −0.011 | −0.089 | 0.027 | 0.293 | −0.565 | 0.465 | 1.000 |
References
- Ministry of Environment. Ministry of Environment Promotion Plan of Main Business in 2013; Ministry of Environment: Sejong, Korea, 2013. (In Korean)
- Lee, S.-I. A Study on sustainable urban forms for enhancing traffic avoidance—The case of the Kwangju Metropolitan Area (in Korean). J. Korea Plan. Assoc. 2000, 35, 21–33. [Google Scholar]
- Chiesura, A. The role of urban parks for the sustainable city. Landsc. Urban Plan. 2004, 68, 129–138. [Google Scholar] [CrossRef]
- Haase, D.; Larondelle, N.; Andersson, E.; Artmann, M.; Borgström, S.; Breuste, J.; Gomez-Baggethun, E.; Gren, Å.; Hamstead, Z.; Hansen, R. A quantitative review of urban ecosystem service assessments: Concepts, models, and implementation. Ambio 2014, 43, 413–433. [Google Scholar] [CrossRef] [PubMed]
- Camps-Calvet, M.; Langemeyer, J.; Calvet-Mir, L.; Gómez-Baggethun, E. Ecosystem services provided by urban gardens in Barcelona, Spain: Insights for policy and planning. Environ. Sci. Policy 2016, 62, 14–23. [Google Scholar] [CrossRef]
- Langemeyer, J.; Baró, F.; Roebeling, P.; Gómez-Baggethun, E. Contrasting values of cultural ecosystem services in urban areas: The case of park Montjuïc in Barcelona. Ecosyst. Serv. 2015, 12, 178–186. [Google Scholar] [CrossRef]
- Roebeling, P.; Saraiva, M.; Palla, A.; Gnecco, I.; Teotónio, C.; Fidelis, T.; Martins, F.; Alves, H.; Rocha, J. Assessing the socio-economic impacts of green/blue space, urban residential and road infrastructure projects in the Confluence (Lyon): A hedonic pricing simulation approach. J. Environ. Plan. Manag. 2016, 60, 482–499. [Google Scholar] [CrossRef]
- De Groot, R.S.; Wilson, M.A.; Boumans, R.M.J. A typology for the classification, description and valuation of ecosystem functions, goods and services. Ecol. Econ. 2002, 41, 393–408. [Google Scholar] [CrossRef]
- Daily, G.C.; Söderqvist, T.; Aniyar, S.; Arrow, K.; Dasgupta, P.; Ehrlich, P.R.; Folke, C.; Jansson, A.; Jansson, B.O.; Kautsky, N.; et al. Value of nature and the nature of value. Science 2000, 289, 395–396. [Google Scholar] [CrossRef] [PubMed]
- Vandermeulen, V.; Verspecht, A.; Vermeire, B.; Van Huylenbroeck, G.; Gellynck, X. The use of economic valuation to create public support for green infrastructure investments in urban areas. Landsc. Urban Plan. 2011, 103, 198–206. [Google Scholar] [CrossRef]
- Van Berkel, D.B.; Verburg, P.H. Spatial quantification and valuation of cultural ecosystem services in an agricultural landscape. Ecol. Indic. 2014, 37 Pt. A, 163–174. [Google Scholar] [CrossRef]
- Bolund, P.; Hunhammar, S. Ecosystem services in urban areas. Ecol. Econ. 1999, 29, 293–301. [Google Scholar] [CrossRef]
- Gómez-Baggethun, E.; Barton, D.N. Classifying and valuing ecosystem services for urban planning. Ecol. Econ. 2013, 86, 235–245. [Google Scholar] [CrossRef]
- Irvine, K.N.; Warber, S.L.; Devine-Wright, P.; Gaston, K.J. Understanding urban green space as a health resource: A qualitative comparison of visit motivation and derived effects among park users in Sheffield, UK. Int. J. Environ. Res. Public Health 2013, 10, 417–442. [Google Scholar] [CrossRef] [PubMed]
- Plieninger, T.; Dijks, S.; Oteros-Rozas, E.; Bieling, C. Assessing, mapping, and quantifying cultural ecosystem services at community level. Land Use Policy 2013, 33, 118–129. [Google Scholar] [CrossRef]
- Daams, M.N.; Sijtsma, F.J.; van der Vlist, A.J. The effect of natural space on nearby property prices: Accounting for perceived attractiveness. Land Econ. 2016, 92, 389–410. [Google Scholar] [CrossRef]
- Zhang, X.; Lu, H.; Holt, J.B. Modeling spatial accessibility to parks: A national study. Int. J. Health Geogr. 2011, 10, 1. [Google Scholar] [CrossRef] [PubMed]
- Wright Wendel, H.E.; Zarger, R.K.; Mihelcic, J.R. Accessibility and usability: Green space preferences, perceptions, and barriers in a rapidly urbanizing city in Latin America. Landsc. Urban Plan. 2012, 107, 272–282. [Google Scholar] [CrossRef]
- Nicholls, S. Measuring the accessibility and equity of public parks: A case study using GIS. Manag. Leis. 2001, 6, 201–219. [Google Scholar] [CrossRef]
- Omer, I. Evaluating accessibility using house-level data: A spatial equity perspective. Comput. Environ. Urban Syst. 2006, 30, 254–274. [Google Scholar] [CrossRef]
- Wolch, J.; Wilson, J.P.; Fehrenbach, J. Parks and park funding in Los Angeles: An EQUITY-MAPPING ANALYSIS. Urban Geogr. 2013, 26, 4–35. [Google Scholar] [CrossRef]
- Strand, J.; Vågnes, M. The relationship between property values and railroad proximity: A study based on hedonic prices and real estate brokers’ appraisals. Transportation 2001, 28, 137–156. [Google Scholar] [CrossRef]
- Luttik, J. The value of trees, water and open space as reflected by house prices in the Netherlands. Landsc. Urban Plan. 2000, 48, 161–167. [Google Scholar] [CrossRef]
- Jim, C.Y.; Chen, W.Y. Impacts of urban environmental elements on residential housing prices in Guangzhou (China). Landsc. Urban Plan. 2006, 78, 422–434. [Google Scholar] [CrossRef]
- Ko, H.-J.; Yun, K.-B.; Shim, Y.-J.; Hwang, H.-Y. Impact analysis of an eco-park on the adjacent apartment unit price by using the hedonic model. J. Korean Hous. Assoc. 2011, 22, 47–57. [Google Scholar] [CrossRef]
- Oh, D.-H.; Lee, C.-B. An Analysis on the effect of view and story on the price of Hanriver Riverside apartments. J. Korea Plan. Assoc. 2003, 38, 247–257. [Google Scholar]
- Jang, Y. Valuing the Green-Zone in the City of Seoul and Willingness to Pay of Citizen; Graduate School of Yonsei University: Seoul, Korea, 2005. [Google Scholar]
- Freeman, M., III; Herriges, J.A.; Kling, C.L. The Measurement of Environmental and Resource Values: Theory and Methods; Routledge: Abingdo, UK, 2010. [Google Scholar]
- Kwon, O.-S. Environmental Economics; Pakyoungsa: Seoul, Korea, 2007. [Google Scholar]
- Tietenberg, T.H.; Lewis, L. Environmental and Natural Resource Economics; Routledge: Abingdo, UK, 2016. [Google Scholar]
- Brander, L.; Brouwer, R.; Wagtendonk, A. Economic valuation of regulating services provided by wetlands in agricultural landscapes: A meta-analysis. Ecol. Eng. 2013, 56, 89–96. [Google Scholar] [CrossRef]
- Sander, H.A.; Haight, R.G. Estimating the economic value of cultural ecosystem services in an urbanizing area using hedonic pricing. J. Environ. Manag. 2012, 113, 194–205. [Google Scholar] [CrossRef] [PubMed]
- Escobedo, F.J.; Adams, D.C.; Timilsina, N. Urban forest structure effects on property value. Ecosyst. Serv. 2015, 12, 209–217. [Google Scholar] [CrossRef]
- Payton, S.; Lindsey, G.; Wilson, J.; Ottensmann, J.R.; Man, J. Valuing the benefits of the urban forest: A spatial hedonic approach. J. Environ. Plan. Manag. 2008, 51, 717–736. [Google Scholar] [CrossRef] [Green Version]
- Kim, Y.-J.; Kim, K.-H. Valuation of Urban Leisure Parks: An Application of Hedonic Price Model. J. Tour. Sci. 2007, 31, 265–286. [Google Scholar]
- Hwnag, H.-K.; Lee, C.-M.; Kim, M.-K. Effect of visibility of the Han River on housing price. Hous. Stud. Rev. 2008, 16, 51–72. [Google Scholar]
- Bockstael, N.; McConnell, K.E. Environmental and Resource Valuation with Revealed Preferences: A Theoretical Guide to Empirical Models; Springer: Berlin, Germany, 2007; Volume 7. [Google Scholar]
- Kim, S.; Lee, S.; Yoon, Y.; Kwak, S.; Eom, Y.; Kim, Y.; Cho, S.; Ryu, M. The Measurement of Environmental & Resource Values: Method and Application; Korea Research Institute for Human Settlements: Sejong, Korea, 2005; (http://library.krihs.re.kr/upload/publication/publication/RR2004-12.pdf). [Google Scholar]
- Seoul Metropolitan Government. Hundred Parks in Seoul; Seoul Metropolitan Government: Seoul, Korea, 2008.
- Seoul Metropolitan Government. Boramae Park. Available online: http://parks.seoul.go.kr/template/ default.jsp?park_id=boramae (accessed on 5 December 2016).
- Kim, D.-J. Influence of urban green space environment on the value of residential properties: The case of apartment in Seoul. Korean J. For. Econ. 2002, 10, 8–19. [Google Scholar]
- Sander, H.; Polasky, S.; Haight, R.G. The value of urban tree cover: A hedonic property price model in Ramsey and Dakota Counties, Minnesota, USA. Ecol. Econ. 2010, 69, 1646–1656. [Google Scholar] [CrossRef]
- Mansfield, C.; Pattanayak, S.K.; McDow, W.; McDonald, R.; Halpin, P. Shades of green: Measuring the value of urban forests in the housing market. J. For. Econ. 2005, 11, 177–199. [Google Scholar] [CrossRef]
- Li, W.; Joh, K.; Lee, C.; Kim, J.H.; Park, H.; Woo, A. Assessing benefits of neighborhood walkability to single-family property values: A spatial hedonic study in Austin, Texas. J. Plan. Educ. Res. 2015, 35, 471–488. [Google Scholar] [CrossRef]
- Giuliano, G.; Gordon, P.; Qisheng, P.; Park, J. Accessibility and Residential Land Values: Some Tests with New Measures. Urban Stud. 2010, 47, 3103–3130. [Google Scholar] [CrossRef]
- Cutts, B.B.; Darby, K.J.; Boone, C.G.; Brewis, A. City structure, obesity, and environmental justice: An integrated analysis of physical and social barriers to walkable streets and park access. Soc. Sci. Med. 2009, 69, 1314–1322. [Google Scholar] [CrossRef] [PubMed]
- Li, H.; Wei, Y.D.; Yu, Z.; Tian, G. Amenity, accessibility and housing values in metropolitan USA: A study of Salt Lake County, Utah. Cities 2016, 59, 113–125. [Google Scholar] [CrossRef]
- Munoz-Raskin, R. Walking accessibility to bus rapid transit: Does it affect property values? The case of Bogotá, Colombia. Transp. Policy 2010, 17, 72–84. [Google Scholar]
- Chin, H.C.; Foong, K.W. Influence of school accessibility on housing values. J. Urban Plan. Dev. 2006, 132, 120–129. [Google Scholar] [CrossRef]
- Geurs, K.T.; van Wee, B. Accessibility evaluation of land-use and transport strategies: Review and research directions. J. Transp. Geogr. 2004, 12, 127–140. [Google Scholar] [CrossRef]
- Jim, C.; Shan, X. Socioeconomic effect on perception of urban green spaces in Guangzhou, China. Cities 2013, 31, 123–131. [Google Scholar] [CrossRef]
- Seoul Metropolitan Government. Seoul Statistics. Available online: http://stat.seoul.go.kr/ (accessed on 5 December 2016).


| Category | Variables | References |
|---|---|---|
| Characteristics of house | Area of a house Number of bathroom Number of bedrooms House type (Single family or multi-family) Age Garage Size/number of units of apartment complex Level Prospect of the river Administrative division Socio-economic factor (population, income, etc.) | [7,25,26,32,33,34,35,36] [25,33,34] [25,33,34] [33] [26,32,33,34,35] [25,34,36] [25,26,35,36] [25,26,36] [26,36] [36] [7] |
| Characteristics of neighborhood | CBD/Downtown (Euclidean distance) Elementry school district High school district Tax rate Accessibility to employment Distance to the bus stop Distance to the subway station Distance to the shopping mall | [32,34,35,36] [25,26,35] [32,36] [32,34] [34] [25,35] [26,36] [25,26,35] |
| Characteristics of environment | Relative to tree cover Relative to grass/lawn Number of trees Relative to shrub Plot tree leaf area index Plot tree biomass Lake (Euclidean distance) Park (Euclidean distance) Relative to NDVI (Normalised Difference Vegetation Index) Adjacent to moutains/rivers | [32,33] [32,33] [33] [32,33] [33] [33] [32] [25,26,32,35] [34] [25] |
| Variables | N | Mean | S.D. |
|---|---|---|---|
| Price (in thousand dollars) | 167 | 463.2 | 112.0 |
| Square area of a house (m2) | 167 | 86.9 | 22.4 |
| Floor level of a house (floor) | 167 | 11.2 | 7.2 |
| Age of a building (years) | 167 | 13.2 | 4.9 |
| Distance to the nearest bus stop (m) | 167 | 355.4 | 107.4 |
| Distance to the nearest elementary school (m) | 167 | 575.2 | 284.6 |
| Distance from the park (accessibility) (m) | 167 | 716.0 | 247.0 |
| Variables | Coefficient | Std. Error | t-Value | Sig. | VIF |
|---|---|---|---|---|---|
| Constant | 10.099 | 0.169 | 59.594 | 0.000 | |
| Area of a house | 0.724 | 0.019 | 37.162 | 0.000 | 1.101 |
| Floor level of a house | 0.035 | 0.006 | 5.509 | 0.000 | 1.121 |
| Age of a building | −0.321 | 0.014 | −22.220 | 0.000 | 1.770 |
| Distance to the nearest elementary school | −0.187 | 0.010 | −18.682 | 0.000 | 1.716 |
| Distance from the park | −0.114 | 0.014 | −8.130 | 0.000 | 2.068 |
| Zone (dummy) | 0.033 | 0.017 | 1.926 | 0.056 | 2.464 |
| R square | 0.946 | ||||
| F-value | 470.227 (sig. 0.000) | ||||
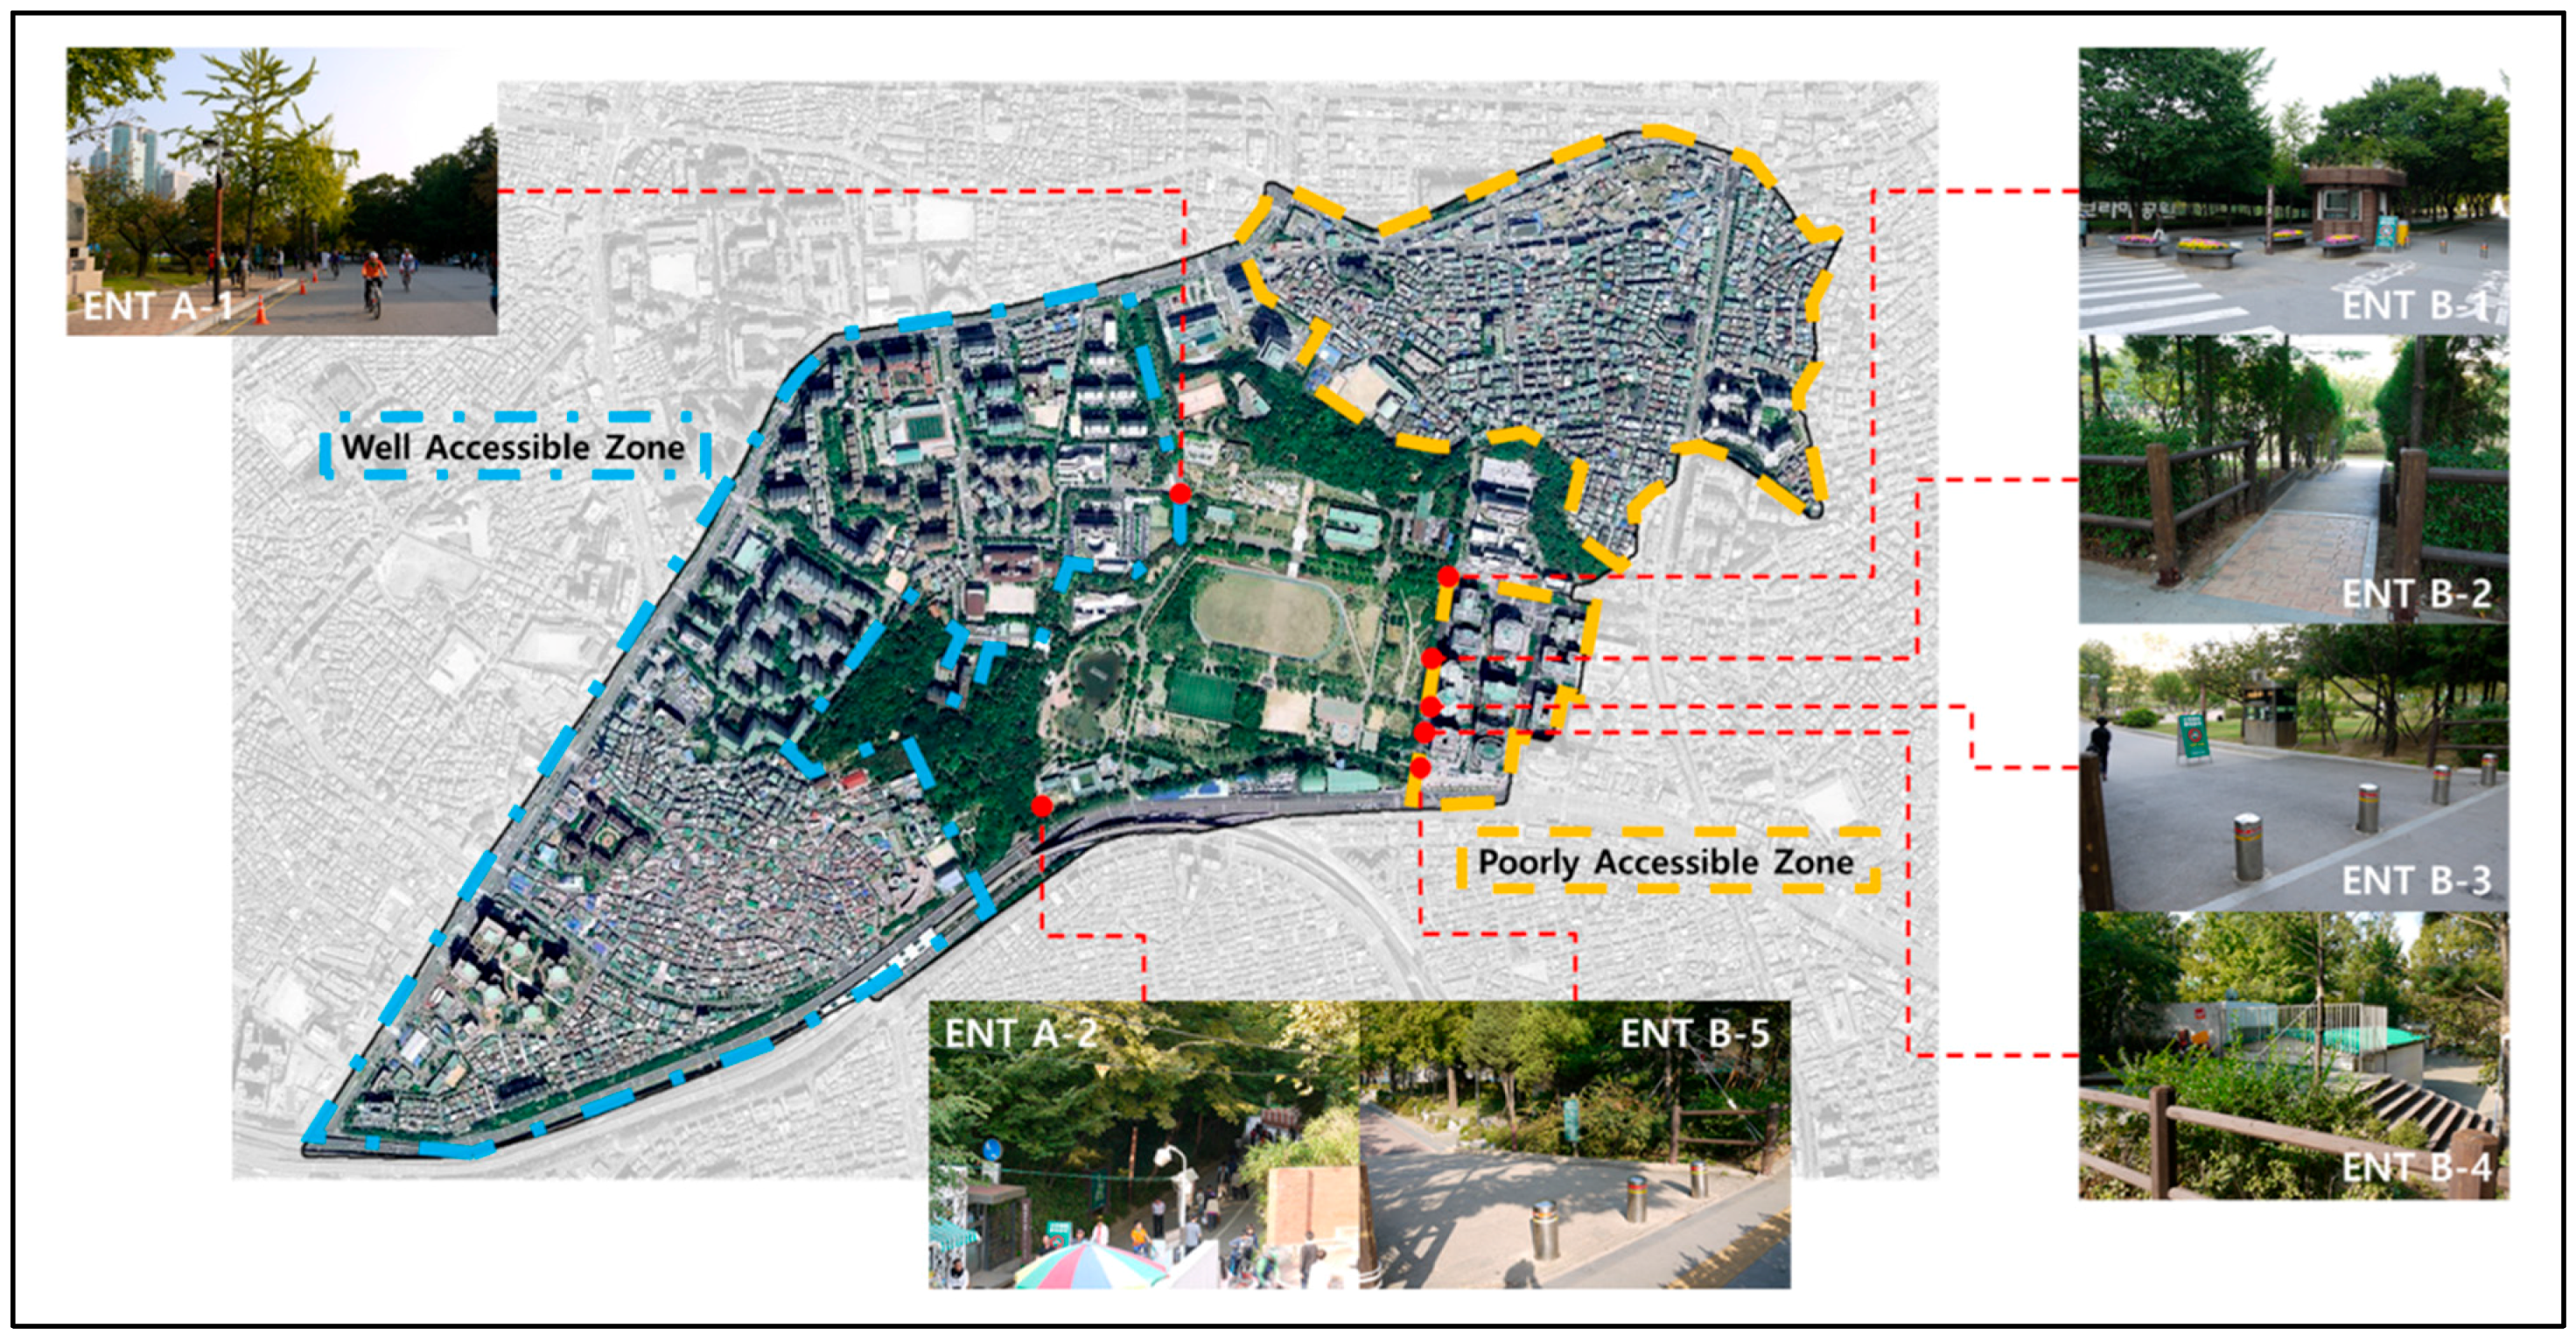
| Well Accessible Zone | Poorly Accessible Zone |
|---|---|
 Access structure of well accessible zone |  Access structure of poorly accessible zone |
| Number of arterial roads: 0 | Number of arterial roads: 1–3 |
| Mean distance for pedestrians: 771 m (SD: 202 m) | Mean distance for pedestrians: 542 m (SD: 295 m) |
| Number of park entrances: 2 | Number of park entrances: 5 |
© 2017 by the authors. Licensee MDPI, Basel, Switzerland. This article is an open access article distributed under the terms and conditions of the Creative Commons Attribution (CC BY) license ( http://creativecommons.org/licenses/by/4.0/).
Share and Cite
Park, J.H.; Lee, D.K.; Park, C.; Kim, H.G.; Jung, T.Y.; Kim, S. Park Accessibility Impacts Housing Prices in Seoul. Sustainability 2017, 9, 185. https://doi.org/10.3390/su9020185
Park JH, Lee DK, Park C, Kim HG, Jung TY, Kim S. Park Accessibility Impacts Housing Prices in Seoul. Sustainability. 2017; 9(2):185. https://doi.org/10.3390/su9020185
Chicago/Turabian StylePark, Jin Han, Dong Kun Lee, Chan Park, Ho Gul Kim, Tae Yong Jung, and Songyi Kim. 2017. "Park Accessibility Impacts Housing Prices in Seoul" Sustainability 9, no. 2: 185. https://doi.org/10.3390/su9020185